The Basics
Use Colour, Shape and Grouping
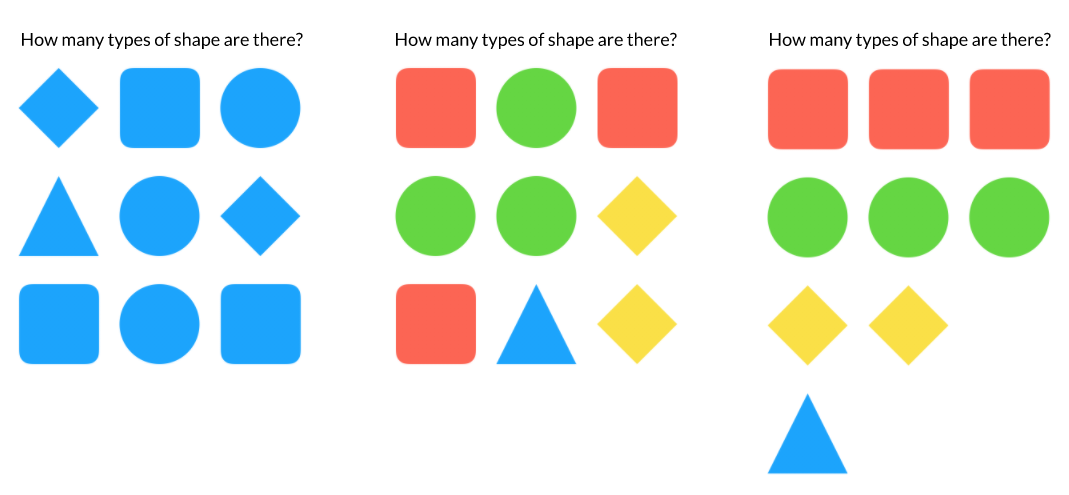
Reducing information overload is not necessarily about reducing the amount of things on a screen, it’s about organising things in the optimum way so that they can be easily processed by the brain. Visual aspects like colour, position, shape, texture and movement register pre-attentively.
Coherent visual cues can make relationships easier to recognise. More cues are not automatically better: competing colours, shapes and movement can obscure the distinctions that matter. If all this is new to you, it's time to brush up on your Gestalt Principles — they still do real work in modern interface and diagram design12.
In a complex application, several purposeful colours can distinguish categories or states. Pair colour with another cue so that the distinction remains available without colour perception. Using shape/ colour/ size/ grouping is the most pure example of synergy in software design, the resulting whole being so much greater than the sum of its parts.
Contrast and Legibility
This can be quite a challenge in complex apps with many different areas, app states, UI states and depth levels. Accessibility is a requirement for good software design, so plan for it from the outset. For web interfaces, WCAG 2.2 generally requires a text contrast ratio of 4.5:1, or 3:1 for large text, with specified exceptions.4 The 3:1 threshold is not a general baseline for ordinary inspector labels. Native applications also need the relevant platform accessibility guidance.
At a design conference two legally blind people came to do a workshop in our DCC. It wasn't great, and we will do better. Contrast is only part of that work: keyboard access, focus, structural alternatives and interface scaling matter too. See Accessibility in Creative Tools for practical checks.
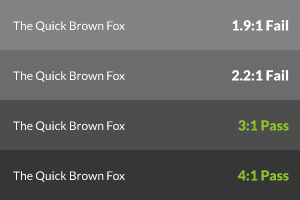
The illustration shows how background changes affect contrast in a dark interface. Check each actual text and background pair against the applicable threshold, including hover, selected and disabled states. It may in fact be easier to represent certain states in one or more different ways, for example underlining text, using outlines, changing colours, textures and such.
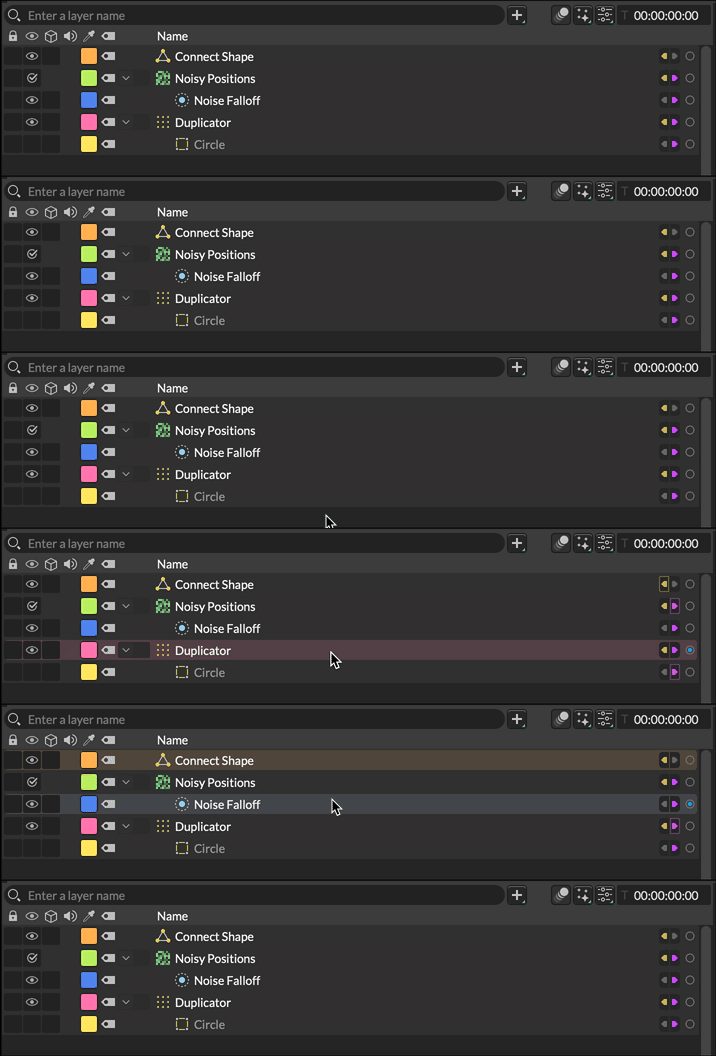
As mentioned, one easy way to increase legibility is to use colour tints. We use them in Cavalry in our hover and selected states (which are lighter than the deselected state, and would thus otherwise reduce the contrast between the name text and background).
Another general tip, and this one's personal: I find blue backgrounds fatiguing in long sessions — treat this as preference, not evidence.
Buttons

Once more for the people in the back row, buttons need to look like buttons. By this I do not mean they need to look like the great and honourable Kai Krause designed them, it can still be flat, don't worry, I just mean that it needs to be distinct from an icon. Controls need cues that communicate their purpose and availability.5 An icon-only button can work in a familiar toolbar, but its appearance, context and accessible name must make the action clear. Test recognition rather than assuming that a familiar icon will be familiar to everyone. Another area for consideration is button labelling, NNG has an article on that here. In short, label your buttons, label your icons. If you don't, know that you're knowingly reducing usability (which is okay, compromises are allowed, just be aware of what it means). One clever way to have your cake and eat it, is to have button/icon labels, but give power users the ability to turn them off.
Finally, state buttons (on off buttons) need to look distinct from regular buttons in order to avoid needless confusion over what something does.
Icons
The ultimate aim of icon design is to relieve the user of the necessity for recall when trying to locate commands, actions and any other data-carrying element within the graphical user interface. So you should try to make them distinct and easy to recognise, the section above talks about Gestalt Principles which is how you should achieve this. It's worth noting that even with all the Gestalt tricks employed, semiotics (images/ icons) are usually not as effective as text at communicating meaning. I realise I just mentioned this under buttons, but this is why all the UX courses and top tier designers recommend labelling your icons. I appreciate some visual designers would rather pull their own ears off than do such a thing, but it's only your users you're hurting, unless of course you do actually pull your ears off...
Separate Appeal from Task Performance
Practical check: compare the same task in the proposed presentation and its predecessor. Record recognition, mistakes and completion alongside preference. Check whether a favourable appearance hides a difficult operation.
Text
For Westerners, left align all multi-line text as this minimises the amount of scanning the eyes have to do and the amount of processing required to take in the information. You can however centre align isolated text, like headings, or hints without penalty.